According to Dictionary.com, an infographic a visual presentation of information in the form of a chart, graph, or other image accompanied by minimal text, intended to give an easily understood overview, often of a complex subject. So infographics take a lot of information and put it in a form that easy to understand - sign me up. Who wouldn't want to use this?
Piktochart makes it so easy to create infographics. You and your students can use your Google account to sign in to the website. Click Create a New Piktochart and then choose from pre-designed templates or start from scratch. You can add shapes, charts, images, backgrounds, and more.
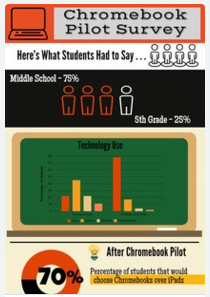
Here are two small clips of infographics I've created -
A great resource for you comes from Kathy Schrock - Infographics as a Creative Assessment. She provides so much information about infographics and how they can be used. There's a lot on the page, but take some time and look through it - it's worth it.


No comments:
Post a Comment